Whitepaper
How to Evaluate Investment Performance
1 April 2013
Most active investment managers fail to justify their fees. Apparent outperformance is often the result of specific market risks, not manager skill. Partners Capital uses a systematic look-through risk quantification process to separate market risks from manager skill. This allows our clients to allocate capital to those managers who are most likely to generate a positive return after their fees. This also allows our clients to hold overall risk levels constant in diversified portfolios, thereby avoiding the performance leakage which typically accompanies both intentional and inadvertent market timing.
Most asset managers destroy value
We at Partners Capital believe that within the $60 trillion global asset management industry, the vast majority of its participants do not justify their fees and should not be in business. In any normal industry where the price (fees in this case) exceeds the value to the customer, the price usually comes down and the industry rationalizes around fewer, leaner successful suppliers who deliver value in excess of price. This is the economic state of disequilibrium and equilibrium that we all know. In the active asset management world today, according to our research, we can prove that for most industry participants, the price (i.e., fees) exceeds the value to the consumer (i.e., alpha to investors), yet we see all too few of these non-economic players leaving the industry, cutting costs or lowering price (fees). This stubbornness of high fee regimes in the absence of out performance remains one of the great mysteries of the financial world.
Bain & Company attributes this economic disequilibrium to the “superabundance of capital” in the world today (some 10x global GDP). It seems that the weight of money trying to earn a better return is just too great a demand to put any pressure on fees. However, we think customers would abandon high fee charging asset managers if they simply understood how to evaluate investment performance. Most investors do not.
For all the rigor in the theory and practice of investing, we have found that very few investors apply the same level of diligence to the evaluation of investment performance. That goes for some of the most highly regarded investors, such as the elite US university endowments and sophisticated Private Equity MDs as well. When we hear that “portfolio X had a great year, up +20%, even beating the equity market which was up +12%” we would most likely conclude nothing more than that the portfolio in question probably had more risk than the equity market. Similarly in down markets, when we hear “portfolio Z had a great year, only down -5% when the market was down -8%,” we assume that that portfolio simply had less risk. We can conclude nothing about a portfolio’s performance without its risk level. In any case, rarely can one draw meaningful conclusions about performance in a single 12-month period.
Arming you with a tool for sorting out the good, the bad and the ugly asset managers
This note is about arming investors with the most effective tool for evaluating asset manager performance and helping to expose the vast majority of asset managers who destroy value every day they walk into their offices. That tool is market risk or beta. The market beta of any investment or portfolio quantifies the normal relationship between the likely change in value of that investment or portfolio as it relates to the change in value of the market as a whole. For example, a beta of 0.6 suggests that, ignoring any alpha and all else being equal, the asset will rise by 6% if the market rises by 10%. The same factor explains movement in reverse; i.e., a 10% market decline would have us expecting the asset’s value to decrease by 6%. So this asset’s market or beta exposure is 60% of that of the market or a beta of 0.6. Thus, beta tells us how much market risk any given portfolio or asset has. There are four primary market risks or betas to measure in any portfolio including equity, credit, interest rate and inflation betas. Over the long term, investors are compensated for being exposed to each of these four risks, and each can be measured for presence in any strategy or portfolio.
Measuring the portion of return derived from beta enables an investor to determine what portion of the return, if any, is derived from manager skill (alpha return) and most importantly, whether the alpha exceeds the fees paid to the manager. Expressed another way, the total return from a portfolio in excess of what is expected based on the market risk or beta exposures, is defined as out performance or alpha and is generally attributed to manager skill. But, of course, the out performance could be due to random occurrences or luck as well. The longer a given asset manager appears to be lucky in this way, the more likely we are to attribute that out performance to skill.
Measuring out performance using traditional benchmarks, as relied upon by many investors, can result in very different performance assessments than assessments using normative beta exposures. Traditional benchmarks very often do not have the same level of market risk or the same mix of market risks as the asset manager being evaluated. We provide two examples of equity managers illustrating this disparity.
Example 1: Large Cap Global “Quality” Equity Manager
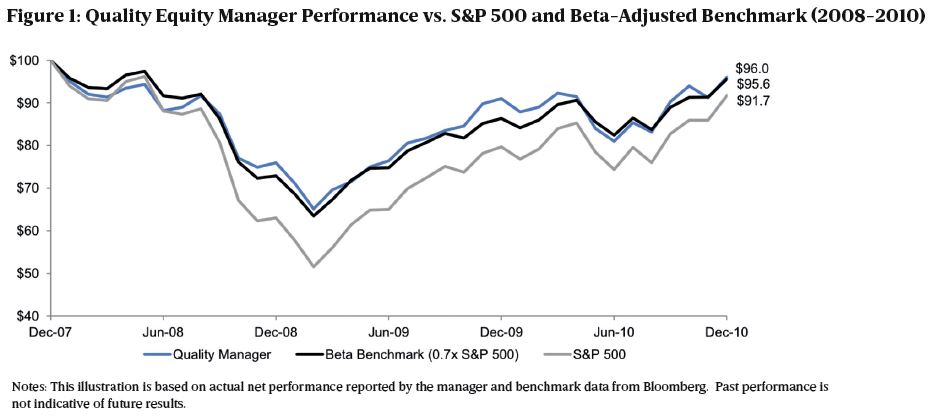
This manager invests in a diversified portfolio of “quality” equities, which typically have very high returns on equity, strong balance sheets and high dividend yield. We assessed this manager to have a normative beta to the broad global equities market of 0.7x. This suggests that, assuming no manager skill, the fund would be expected to return +7% in a year when the broad equity market returns +10%, or to decline -7% when the market falls -10%. A blind comparison of the fund’s returns to those of the broad equity market would lead to false conclusions of manager out performance or under-performance based on whether overall equity markets happen to have increased or decreased during the period.
As can be seen in Figure 1, the Quality Manager’s actual performance (blue line) tracks much more closely to the beta-adjusted benchmark (black line) than the traditional benchmark (grey line). The Quality Manager significantly outperformed the S&P 500 over this three-year period, particularly during 2008, but most of the out performance is explained by the lower risk in the Quality Manager’s portfolio, and not by manager skill or alpha.
 Example 2: US Microcap Equity Manager
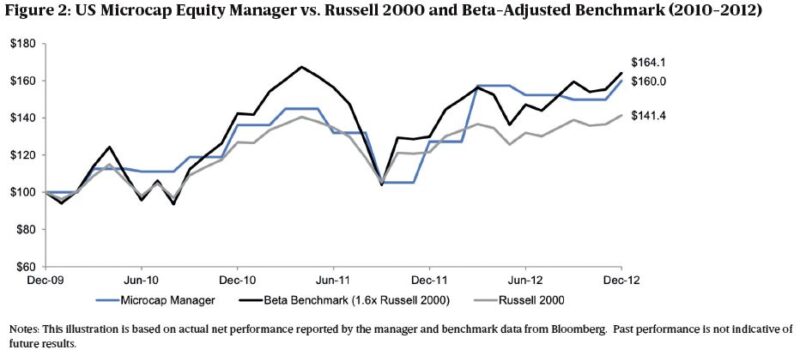
A client recently introduced us to a fund focusing on US companies with market capitalizations under $500 million and little Wall Street research coverage. In theory, these companies should present a greater opportunity for manager skill to exploit market inefficiency. The manager’s 3-year performance from 2010-12 was +17.0% p.a. compared to +12.3% for the traditional benchmark used by the asset manager, which was the Russell 2000 index which comprised mostly small cap companies below $5 billion in market capitalization. We estimated the beta of this portfolio at 1.6x the Russell 2000, suggesting the performance needed to exceed +18.0% over this period to have generated true out performance. Proof of this very high level of market risk was the fact that prior to the last three years, the portfolio saw a cumulative decline of over -70% during the financial crisis. Comparison to the manager’s reported benchmark suggests +5% annual alpha compared to our estimate of -1% value destruction each year, given the high level of market risk in their portfolio. As shown in Figure 2, the Microcap Manager (blue line) significantly outperforms the stated benchmark (Russell 2000, grey line) over this time period, but lags the beta-adjusted benchmark (black line), which is adjusted for the manager’s higher-risk approach.
 Conclusion: The key mistake investors make when evaluating investment performance is to rely on traditional benchmarks and to stop short of accurately determining a manager’s or portfolio’s beta. To avoid this mistake, determine each of the managers’ underlying positions to arrive at a set of “normative beta exposures” and for the overall (multi-manager) portfolio as a whole. With the correct measure of risk, and a time frame covering a full financial cycle, an investor can evaluate his or her own portfolio’s performance, each asset manager’s performance and the performance of a sensible peer group with confidence in the conclusion.
In the remainder of this newsletter, we will detail Partners Capital’s methodology for decomposing returns into alpha and beta and provide ‘real world’ illustrations of how the failure to determine beta accurately can leave the investor badly misinformed of the risk and likely performance of a manager or portfolio in a given market environment. We will also introduce the concept of Equivalent Net Equity Beta or “ENEB” as a means of calculating the full array of beta exposures in a portfolio and the importance of setting and maintaining the portfolio’s ENEB at a level consistent with an investor’s long term investment objectives.
Using beta exposures to benchmark performance and measure manager out performance or alpha for an overall multi-manager, multi-asset class portfolio
Just as with any single asset manager where the most significant determinant of performance is the level of market risk, the same concept applies to assessing the performance of an overall portfolio. To assess portfolio performance accurately, investors should apply a rigorous approach to measuring and monitoring the overall market risk of the portfolio.
We commonly observe investors relying heavily on the standard deviation of returns or “volatility” to determine risk and use that measure to assess overall portfolio performance. While this is a useful measure to understand aggregate portfolio risk, it is too blunt an instrument to accurately understand portfolio risk in a multi-manager multi-asset class portfolio. Firstly, standard deviation does not drill down into the market exposures that generated the returns and volatility. These exposures (or “betas”) to equity, credit or interest rate markets matter greatly in determining how returns were generated. For example, in 2012 a credit portfolio would have looked much better than an equity portfolio since credit provided returns similar to equities with much lower standard deviation. This does not necessarily imply that the credit portfolio is superior to the equity portfolio, but simply that credit performed strongly as a market in 2012. Secondly, managing risk on a forward looking basis is impractical since standard deviations vary substantially over time depending on market conditions. For example during times of market stress, standard deviations rise sharply and during times of stability, standard deviations drop off. Trying to vary exposures to fit within a “standard deviation budget” is very difficult to manage in practice and typically leads to poor results.
A more pragmatic definition of risk is based on measuring betas to each of the key markets risks to which the portfolio is exposed. In view of the dominant role that public equities play in most institutional and individual portfolios, at Partners Capital we use the equity market beta of a portfolio as the most important measure of overall portfolio risk to target and maintain. Given that most portfolios also incorporate exposure to other asset classes, such as fixed income, credit, property and commodities, it is important to capture the market risk or betas of each of these diverse asset classes in any overall portfolio risk measure. Therefore, the portfolio’s beta to each of these markets is first calculated. In order to represent the portfolio’s risk in a single term, we translate each of the asset class risks into the common denominator of equity equivalent risk. We refer to this single risk measure as Equivalent Net Equity Beta (“ENEB”). For example, high yield credit has a high correlation with equity markets, but significantly lower volatility than equities; thus exposure to high yield credit currently gets translated into ENEB at a rate of 0.6 to equities. On the other hand, government bond returns have recently shown a negative -0.2 beta to public equities. So if the portfolio has a 30% allocation to government bonds, the portfolio’s ENEB is reduced by 6% (30% x -0.2). In general, risky assets tend to have a positive ENEB, while safety-oriented assets tend to have a low or negative ENEB. These ‘look-through’ ENEB exposures can be calculated for a portfolio of managers and aggregated together, since they are expressed as a common measurement.
Once the level and nature of each market risk in a portfolio is determined, separating out performance into market exposures and portfolio manager skill (i.e., skill from asset allocation, manager selection, etc.) is relatively straightforward. The return on market exposures is simply the allocation to each market beta multiplied by the passive return from the market indices that corresponds with each beta. We refer to this as the “beta return” of the portfolio.
To calculate the beta exposure of a portfolio, we examine actual manager exposure reports, calculate a multi-factor regression of their performance against indices for each source of beta (e.g., equities, credit, and commodities beta) and then verify our analysis through direct discussions with the manager to confirm their market exposures. This “beta-base” of manager exposures becomes the basis for assessing their performance at the portfolio level accurately. We believe that an investor cannot accurately determine whether a portfolio is performing well or poorly without understanding the aggregate beta in the portfolio.
The introduction of hedge funds to any portfolio highlights the importance of using look-through manager beta exposures to assess a portfolio’s performance. We illustrate this by comparing two hypothetical hedge fund portfolios, described in Figure 3 below.
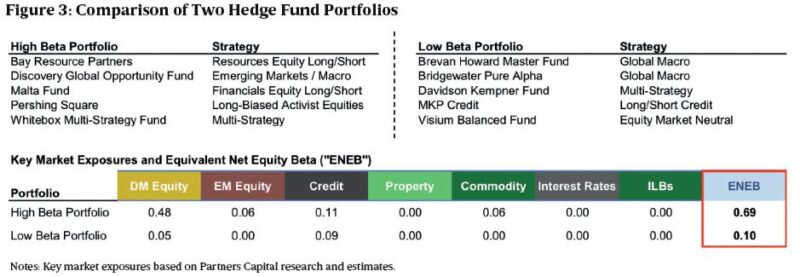
We separated the selected funds into two groups: a High Beta Portfolio, with more directional exposure, and a Low Beta Portfolio, with more market neutral exposure. All of the selected hedge funds are constituents of the Credit Suisse/Tremont Hedge Fund Index, measuring the broad performance of the hedge fund industry. However, deeper analysis of the underlying exposures and performance shows just how different the risk exposures can be between different strategies and managers. The numbers underneath each column heading (DM Equity, EM Equity, etc.) are the betas that each of the two portfolios has to those different market risks. For example, the High Beta Portfolio’s return should rise by +1.1% due to its credit exposure alone if the credit market index rises by +10% (applying the credit beta or factor of 0.11). The underlying market exposures translate to an equivalent net equity beta (ENEB) of approximately 0.69 for the High Beta Portfolio and 0.10 for the Low Beta Portfolio.
Clearly, these risk levels mean that investors should expect vastly different performance from each of the portfolios in different market environments, even though all of the managers are considered “hedge funds.”
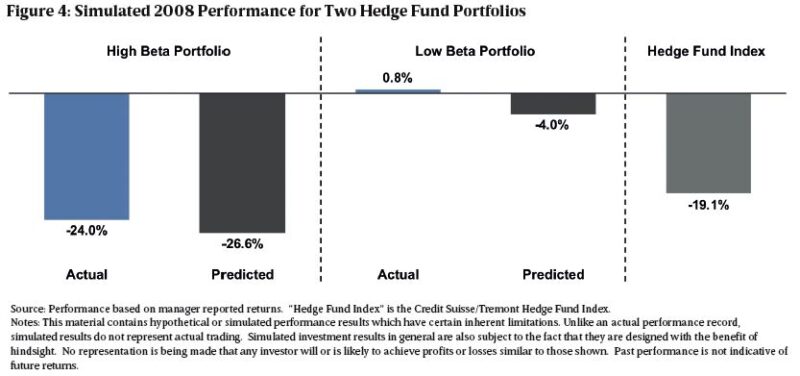
As demonstrated in Figure 4, the two hedge fund portfolios performed very differently in 2008, when global equity markets were down -38.7%. The High Beta Portfolio was down -24.0%, compared to the Low Beta Portfolio which was up slightly at +0.8%. Many investors would look at this 2008 performance on its own and conclude that the Low Beta portfolio was just a better portfolio and defended well in a bad period. While the general conclusion is correct, when the relative beta exposures are taken into account the difference between these two portfolio’s out-performance is just 2.2% in favour of the Low Beta portfolio. The investor should be aware of the return from beta exposures in his portfolio and accepting whatever is delivered is not attributed to the skill of the asset manager.
 Moreover, asset managers should be held accountable primarily for delivering out performance versus the market risks each targets over the long term. The single year is not long enough to conclude anything about performance, especially during a year like 2008. This phenomenon is highlighted by looking at how these same two portfolios performed in 2012.
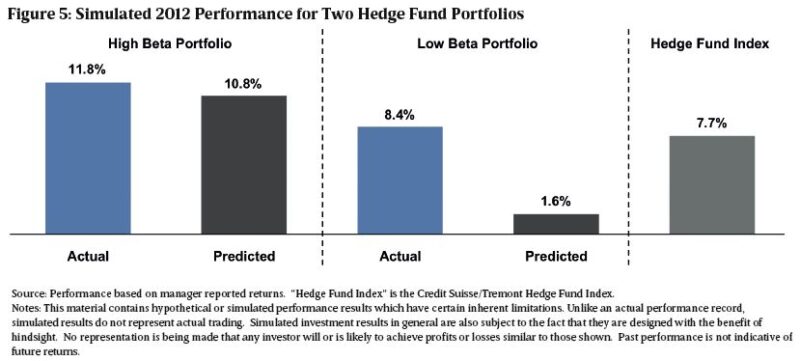
In 2012, a strong year for global equities (+15.7%), the High Beta Portfolio’s total return exceeded that of the Low Beta Portfolio, as market exposures would have predicted. As shown in Figure 5, the High Beta Portfolio was up +11.8%, slightly outperforming its predicted return of +10.8% based on market exposures. The Low Beta Portfolio was up +8.4%, but the return predicted from its beta exposures was only +1.6%, which suggests that Low Beta managers had strong out performance (alpha) in 2012 of +6.8%.
 Monitoring and maintaining overall portfolio risk
At Partners Capital, we believe that it is essential that an investor establish and maintain his or her target overall portfolio beta risk budget (ENEB) and manage the portfolio to that set target. Intentionally varying the overall portfolio beta risk, a form of market timing, tends to result in performance “leakage” more often than not, even for the most sophisticated of investors. The risk adjustments that a collection of asset managers collectively deliver usually has a similar negative result as asset managers focus on their “business risk” rather than long-term performance and may collectively take you out of the market in turbulent periods having you miss performance recoveries. Similarly, managers will often collectively give you risk above your budget in periods of market calm. Howard Marks of Oaktree constantly reminds us that “market risk increases after large price increases, as assets have become more expensive, and market risk declines on the back of a major market drawdown as assets have become cheaper with more upside potential”. Asset managers do not always agree and very often add exposure after prices increase, and reduce exposure after prices decrease – in other words, they buy high and sell low. Smart portfolio managers can curtail the effects of these collective manager actions by monitoring their changing exposures and re-balancing in line with budgeted total portfolio risk through index fund exposures, futures or other overlays.
This discipline of targeting, achieving and maintaining a target portfolio risk level provides three key benefits:
- it enables the investor to have a degree of confidence in how the portfolio will perform in a given market environment,
- it discourages attempts at ‘market timing’ at the portfolio level which our research shows is more likely to destroy value than create it, and
- it allows a more critical assessment of how much total alpha is being derived from the investor’s managers and how correlated or uncorrelated to betas that alpha is.
Maintaining this consistency between beta risk exposures and performance measurement helps to ensure that investment results are considered relative to the risks assumed, thereby avoiding the key mistakes highlighted above. Equally, tracking beta exposure over time is also very important as strategies drift into new areas and active managers change exposures over time.
Determining trends in alpha production
Overall portfolio performance reporting based on beta risk enables the investor to determine trends in alpha production in his or her portfolio. We illustrate this through our own evaluation of the Yale endowment’s beta and alpha sources of return over the last decade as shown in Figure 6 below:
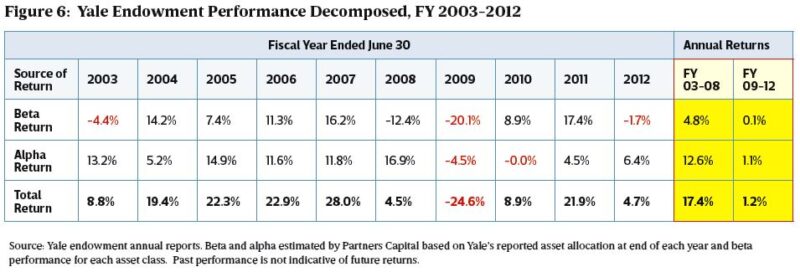
We should emphasize that this analysis is derived from our estimates of Yale’s beta at the asset class level based on information published in Yale’s annual reports, as compared to our typical, much more robust analysis based on exposures at the individual investment level. Nonetheless, we believe that these estimates provide an accurate overall picture of Yale’s sources of return.
Yale has been one of the top performing institutional investors over the last two decades, producing an annual return averaging +13.7% over the 20 years ending June 30, 2012. Notably, Yale’s return from alpha has slowed since the financial crisis. Over the last four fiscal years, we estimate that Yale’s return from alpha has been +1.1% annually, compared to +12.6% annually in the six years leading up to the crisis. This is representative of a broader trend that we have seen across institutional portfolios in recent years. We believe generating alpha has become increasingly challenging due to high correlations across asset classes, zero interest rate policy in developed markets and greater competition within asset classes that were more inefficient in prior years. With the prospects for active management more uncertain than ever, it is critical for investors to monitor the overall level of active management risk (“alpha risk”) being taken and to abandon asset managers without a compelling competitive edge that enables them to consistently deliver alpha in excess of their fees.
We hope this note has usefully underscored how critical it is to understand an asset manager’s market risk exposures in order to evaluate performance, both past and prospective. This relatively simple step is often missed, which may lead one to choose managers that go on to perform very differently than anticipated or redeem managers that may have more robust performance than appears. The cumulative effect of failing to assess manager performance diligently may result in some quite nasty surprises when the portfolio fails to provide the expected participation in up markets or the expected defensiveness in down markets.