Whitepaper
A Primer on Alternative Asset Classes
3 June 2019
The earliest of financial investments, pre-dating traditional stocks and bonds, were investments in private companies, private property, privately negotiated debt (non-bank loans made to companies, individuals or governments) and commodities like gold, wheat and corn. These private investments came about in a widespread manner in the middle of the 19th century.
In the last 100 years, public company stocks (equities) and bonds (both government and corporate) have been the staples of the vast majority of private individual and institutional investment portfolios, relegating private investments to a small fraction of the total amount of capital invested. With the success of the first large technology-based companies being funded by private ‘venture capital’ investors in the 1970s (companies like Intel, Hewlett Packard and Sun Microsystems), private company investing had a resurgence, followed in the 1980s by management teams spinning out of big public companies looking for private capital to back them in ‘management buyouts’ or MBOs. On the back of the success of MBOs which used debt to lower the cost of capital for entrepreneurs, leveraged private property investing similarly saw resurgence. The supply of capital for these private investments came mostly from sophisticated private individual investors and a handful pioneering institutions.
At the same time that the venture capital world was fueling the resurgence of private company investing, the practice of borrowing stocks from banks or other owners enabled investors to ‘short’ stocks, betting that specific stock prices would fall, thereby earning gains on such declines. This ability to short stocks created the first hedge funds in the 1970s. Just as borrowing stocks was a financial industry innovation, so were stock options and futures contracts or so-called ‘derivatives’ (financial contracts whose value ‘derived’ from that of the underlying stocks, bonds or commodities). The creation and use of derivatives served to provide investors with a plethora of new instruments to invest in and new ways to invest. For simplicity, the investing world has labelled all of these non-traditional investment strategies involving publicly traded financial instruments as ‘hedge funds’. The inefficiencies associated with the newness of these instruments generated extraordinary levels of investment returns which enabled hedge fund practitioners to charge much higher fees than traditional long-only stock and bond fund managers. But investors in these so-called “alternative investments” were generally outperforming traditional investors on the basis of higher net of fee performance.
The high returns of venture capital, MBOs, leveraged property investing and hedge funds caught the attention of many individual and institutional investors. In the 1980’s and ‘90s, the Yale University endowment, under the leadership of David Swenson, was one of the early investors in most of these strategies and their exceptionally strong performance around the turn of the century showed what investing in these ‘alternative asset classes’ could do for overall portfolio returns. Subsequently, large amounts of capital flowed into most of these asset classes in the 2000 – 2007 period. While equities fell on average about 30% in the financial crisis of 2008, alternative asset classes on average suffered less which only increased their appeal to investors shortly after the crisis. This was in no way a uniform response as there was huge dispersion in outcomes with some hedge funds and property funds going bust, warding many investors off alternatives. But after the dust settled on the global financial crisis, the extraordinary growth of alternative asset investing resumed.
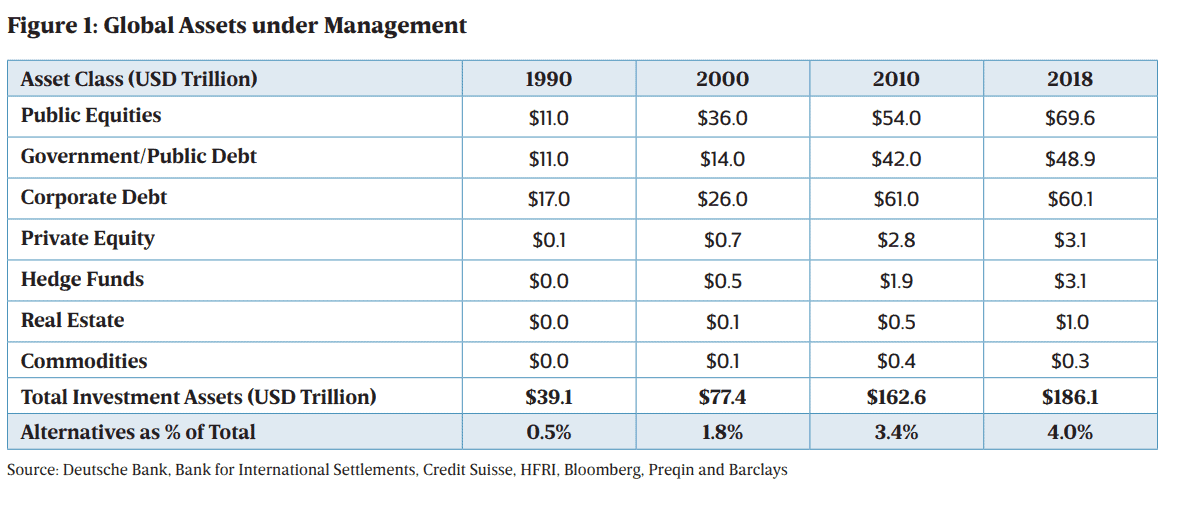
This short history of investing explains how we got to where we are today with respect to alternative investments. As you can see from Figure 1 on the next page, alternatives still only represent 4.0% of the total universe of investments; a modest increase from 3.4% in 2010 but a material increase since 1990 and 2000 when alternatives as a share of the overall investment universe were 0.5% and 1.8% respectively.
The small percentage of the overall investment universe that alternative investments represent highlights how vulnerable the ‘excess’ returns are from these asset classes. There is some amount of capital that, if it were to flow into alternative asset classes, would depress likely returns to points below the risk-adjusted returns of traditional asset classes. The primary obstacle to capital flooding into alternative asset classes is the illiquid nature of some or most of them. High fees and complexity are also obstacles. Finally, many of the best alternative funds limit the amount of capital they take, as the managers have their own personal capital invested and do not want to see dilution of returns on their own assets. Capital inflows to alternatives generally slow down when investors feel they can only access the ‘second best’ funds that remain open.
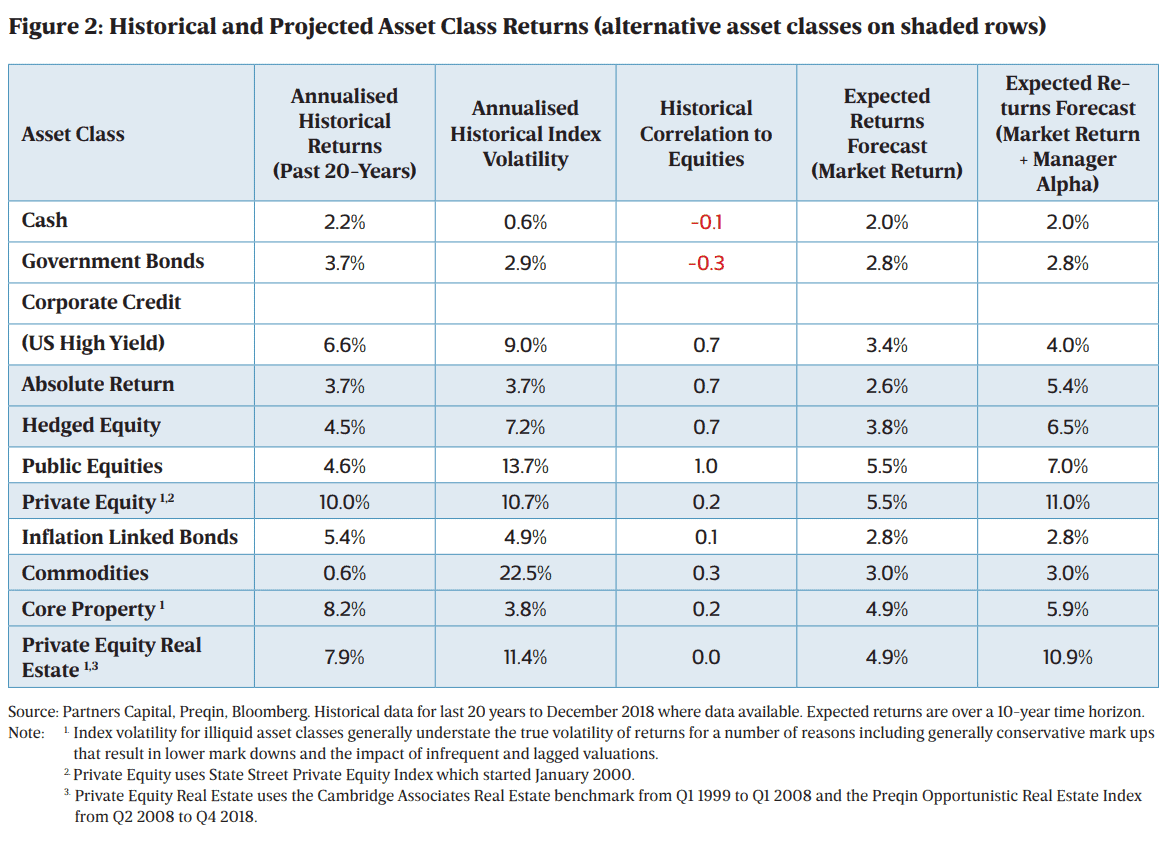
Figure 2 overleaf highlights the superior historical (and projected future) returns of alternative asset classes (highlighted in blue) relative to traditional asset classes. Commodities is the notable exception.
So, this story leads us to the recommendation we make to our clients about alternative investments. Investors should only participate in those alternative asset classes which they can understand and where they can credibly gain access to managers who have a high likelihood of generating excess returns.
With that lesson in mind, we now attempt below to tackle the first of these requirements, i.e., seeking to help you understand these asset classes. One cannot achieve that in a simple written document, but in as brief a fashion as possible, we seek to provide sufficient understanding for you to feel comfortable investing in the asset class.
Below, we will define each alternative asset class, explain the determinants of investment returns in that asset class and highlight the risks embedded in each. We will cover five of the seven major alternative asset classes including private equity, property, private debt, hedged equities and absolute return hedge funds.
I. Private Equity
As described above, private equity investing involves simply owning private companies through private equity firms that endeavor to help management improve their operations. The advent of private equity precedes publicly traded equities, but the institutionalization of this asset class came out of the venture capital world in the 1970s where individuals were given the opportunity to co mingle their funds with those of others into a single fund structure. One could argue that without the advent of venture capital funds, companies like Microsoft, Intel, Google, eBay and Facebook would never have existed. Venture capital firms were started by entrepreneurial individuals who clearly did make a difference in the fortunes of the companies they backed.
Today venture capital remains a very small investment sector. The amounts of capital needed to start new technology companies are small and getting smaller. Due to the high profile that the small number of winning companies get, too much capital flows into this sector and results in low returns for the venture capital sector as a whole. It is a well-known fact that only a handful of veteran venture firms have the ability to generate attractive returns and they generally do not take new investors as they are very loyal to their original investors. There are some specialists, niche focused venture capital funds that raise more substantial sums as they typically back technology firms later in their lives when most of the existential risk is behind them. This would include funds like Tiger Global, Sequoia Capital’s growth funds, Softbank Insight Ventures and others who invest in internet companies prior to them going public.
Today, venture capital represents c.20% of the capital committed to the private equity sector overall. The largest sub-sector of private equity is management buyouts. The most iconic early pioneer of management buyout (MBO) investing was KKR, popularized via the book ‘Barbarians at the Gate’. MBO or leveraged buyout (LBO) firms as they are more commonly referred to today, such as KKR, TPG, Apollo, Carlyle, Bain Capital and CVC today raise very large funds ($10 billion to $15 billion) with most investment capital coming from pensions, endowments, foundations, sovereign wealth funds and very wealthy individuals. Virtually all LBO or private equity investing (venture capital, LBO, growth equity and other types of private company investing) is done through co-mingled fund structures (often being legally formed as partnerships). Each fund will invest their capital over an average period of 4-5 years in approximately 10 to 15 companies. They will purchase these companies borrowing 50-65% of the purchase price with the remainder coming from the MBO fund investors acquiring usually controlling interest in the company’s equity.
The leverage works just like it does with a mortgage on property. If you have 60% of the value of a company financed with debt and 40% with equity, and the value of the overall business goes from say $100 million to $140 million while owned by the MBO fund, that fund has a two-times or 100% return on the $40 million of equity after paying back the $60 million debt.
Obviously, the reverse is a more painful situation, in that if the value of the company goes down from $100 million to $60 million, the value of your equity is zero. So, leverage increases risk and return. But in a diversified portfolio of 10-15 companies, the survivors typically outnumber the losers and overall average annual returns exceed what the public equity markets return by about 5% on average.
The risk of leverage is significantly reduced if the LBO firm is able to help the company grow their profits faster than they could on their own. Accepted wisdom is that private ownership is better for growing profits than public ownership. Public ownership fosters bureaucracy and short-termism as management teams are focused on keeping their jobs rather than enriching public shareholders. LBOs always bring management in as part owners with fully aligned incentives with shareholders. Quarterly earnings reports do not dominate their actions, but rather the exit value some five or more years down the road. This longer-term outlook enables management to invest to lower costs, build products, brands and distribution that helps them gain market share over public or weaker private competitors. In some, but not all, cases, the LBO firm brings added skills and resources to management teams to further enhance their abilities to grow earnings. This ability of LBO firms to add value to companies beyond what the management team is capable of has seen mixed results, but generally is more successful with firms that focus on smaller companies who cannot attract the best management team or cannot afford high quality external advisors.
In large part due to the fact that private company valuations are not significantly influenced by the sentiment-driven public equities market, such companies can weather financial storms better. Banks will be flexible on calling in their loans when they can see the private company may have a way out of their troubles. If we look at the 89 private equity funds that we have invested in through our Condor vehicles (Condor I through Condor VIII), 89% of them are valued above the original capital invested and have an average value of 175% of the original invested capital.
Of the 11% of private equity funds that are marked below cost, the value of those today is approximately 71% of the original invested capital. We believe that our experience of investing in private equity is not materially different from the average private equity investor with qualified individuals performing research on the funds before investing. That experience says that a diversified portfolio of private equity funds generally will have the winners significantly offsetting the losses of the handful of poor performing funds.
The area of private equity investing in which we have highest confidence is with smaller LBO funds (under $1 billion in fund assets) who focus on smaller companies and have an industry sector focus with expertise in sectors such as health care, software, distressed opportunities, business services and consumer goods and retail. These firms tend to find companies that are not taken into professionally run auctions that drive up purchase prices. Smaller, or what we call ‘lower middle market’ buyout funds, tend to buy companies at lower prices and have the skills to acquire similar businesses and merge them together to form larger companies that are sold in professionally run auction processes for higher prices. We believe this should be the focus of the majority of investments in private equity. Such investments should be concentrated in the US and Northern Europe, with a growing set of opportunities in China.
We expect such investments to generate net returns of around 11% per annum net of all fees and expenses. Private equity managers charge high fees of 1.5% to 2% per year on the amount committed (including amounts not yet invested) and they typically retain 20% of the gains after the fund returns exceed around 8%(1). If you committed $10 million to a private equity fund, you
should expect the average lower middle market buyout fund manager will call about 25% of the capital each year, requiring on average four years to invest the capital. Our rule of thumb is that 100% of the capital invested should have been realized and distributed after year 7 and the full amount of gains paid out by years 10-12. So, these are long term investments.
The most common risk associated with LBO investments is that LBO funds may overpay for companies they purchase due to the pressure on them to deploy their capital in a very ‘hot’ market environment. To help them justify the high prices, they often will look to lower their average cost of capital by taking on too much debt to buy them (e.g., >70% of enterprise value). This usually happens just as we enter an economic downturn that has the underlying over-leveraged companies struggling to make required interest and principal payments on their loans. Companies can default on their debt and the equity value of those companies can go to zero. But as we noted above, the banks or other institutions that hold the debt are typically incentivized to work with the equity owners to find ways to help the company recover. We watch carefully for firms who are ‘patient’ investors to minimize this sort of risk. Other risks common to private equity investing include the following:
1. Turnover in the private equity firm management team. This generally triggers a ‘key man’ clause that obligates the firm to stop investing and cancel uncalled commitments.
2. Over-concentration in one or two big investments that fail to generate gains
3. Fund commitments are made at a time coinciding with a weak point in the economic cycle where it is difficult to grow revenue or profits.
4. It takes longer to exit investments due to where we are in the economic cycle at the end of the fund’s life.
Most of these risks can be mitigated by having a well-diversified portfolio across different funds, sectors and vintages (time frames) and targeting firms with strong internal teams who adhere to their diversification policies.
II. Property
Property investing is the largest and the oldest of the asset classes. Investments are either direct or through collective investment vehicles (funds). Property funds can be in the form of public property companies, publicly quoted Real Estate Investment Trusts (REITs) or private equity style private property funds (legally formed as partnerships or companies).
Investments in property benefit from a combination of rental yield and longer-term capital appreciation. Both of these sources of return are related to the rate of inflation and so property has an important role within a diversified portfolio in hedging against inflation. In addition, the total return from property is relatively uncorrelated to that of either public equities (correlation co-efficient of 0.2) and also that of sovereign bonds (negative correlation of -0.2 over the last 20 years). However, investments in property have some important disadvantages.
Firstly, property investments are inherently illiquid as there is no public market for the underlying asset and each asset is unique with its own revenue, cost and physical features that any buyer would need to understand prior to buying. This issue is exacerbated by the high cost of holding property investments, with costs such as insurance, security and local government taxes being incurred even if there is no return from the asset.
Secondly, trading in property is expensive relative to other asset classes. Most governments extract a tax from property transactions. For example, in the UK the taxes applied for commercial property transactions ranges between 0 to 7%. The professional costs of valuing, conveyancing and negotiating property transactions can add a further 2% to 3% of costs to property transactions. This second disadvantage adds to the relative illiquidity of the asset class.
Thirdly, despite being the oldest asset class, the available investment vehicles in property are some of the most limited and poorly managed. Partners Capital has found fewer consistent generators of excess return in property than in any other asset class. This is partly a reflection on the relatively poor quality of investment professionals attracted to collective property investment vehicle management.
There are three main ways in which allocations to property are invested:
1. Real Estate Investment Trust (REITs) – These are co-mingled publicly quoted property investment vehicles that were originally introduced by Dwight Eisenhower in the US in 1960 to make the asset class more accessible to smaller investors. The global uptake of REITs has been significant with combined market capitalization of global REITs reaching $1.7 trillion in September 2017. REITs normally deploy mortgage leverage on the individual properties within their portfolios. REITs are traded like shares with the associated benefits of liquidity. However, as they trade like shares, REITs also demonstrate a strong relationship to public equity returns which diminishes the diversification benefit they deliver (correlation coefficient of US REITs to the S&P 500 is 0.6 since January 2000). This means that many sophisticated, institutional investors do not use REITs as a property investment vehicle.
2. Core Property Funds – These are co-mingled investment vehicles that issue units to investors and invest the subscription proceeds in diversified portfolios of commercial properties. The purchased properties are typically let to tenants with good covenants and so the main source of return is rental yield currently averaging around 6% per annum. Typically, Core Property Funds offer investors quarterly liquidity although there is always the right to suspend redemptions should market conditions deteriorate. Returns from Core Property Funds are occasionally enhanced through the use of leverage. The use of leverage is typically modest with the highest levels being two-parts equity supplemented by one-part debt.
3. Private Equity Real Estate (PERE) Funds – PERE Funds are structured in the same way as Private Equity Funds that invest in private companies. Investors commit to a closed end fund and the committed capital is drawn down as opportunities are identified by the manager over several years. PERE funds are typically 10 years in life and the long investment periods allow the managers to add value to the properties they acquire. This typically involves some element of repositioning and renovation but may also involve a change of use (such as converting an office building into a residential building). Of all the investment vehicles, PERE Funds have a liquidity that most closely matches that of the underlying asset and the evidence of manager skill is strongest. Returns from PERE Funds are usually enhanced through the use of leverage of around two-parts of debt to one-part of equity. Subject to overall liquidity constraints, Partners Capital advises clients to maximize investments in property through the highest quality PERE Funds. Our model portfolio allocates 8% of total assets to PERE. The best-known PERE Funds tend to be regionally concentrated specialists mainly due to the local expertise required in analyzing specific properties.
III. Private Debt Strategies
Private debt represents private loans to companies, property owners or consumers. Private debt describes less liquid or not immediately realizable forms of debt. This is in contrast to the liquid corporate bond markets which are readily tradable instruments. Companies that are able to issue bonds in the liquid corporate bond markets are usually large market capitalization companies which have significant financing needs. The biggest issuers in the corporate bond markets are big international banks like Citigroup and JP Morgan and large industrial companies such as General Electric or Ford. By contrast, private debt strategies usually involve lending to much smaller companies; many are unlisted and private in nature and, therefore, find it much more difficult or impossible to access the public liquid corporate bond markets. These companies will either fund themselves with borrowings from banks or alternatively seek financing from private lenders.
Since the global financial crisis in 2008, the opportunity set for private debt has improved dramatically due to the subsequent shrinking of bank balance sheets and increased capital reserve
requirements. Changes in banking regulations such as Dodd Frank and Basel III have skewed bank lending activity toward just the highest quality ‘plain vanilla’ corporate and mortgage lending. Risky, complex and small company lending have higher bank capital reserve requirements and involve higher bank underwriting costs. This has left a large a gap for investors to step in to lend to credit worthy companies with good protections in place (known as covenants) that will protect creditors in more adverse economic conditions. As the private debt market has grown over the last few years, investors including Partners Capital have shifted focus away from traditional corporate lending into sector specialists and other niche lenders (litigation financing, royalty financing, etc.) where we see the best risk-adjusted return going forward.
We expect our clients to earn around 8% from private debt strategies at this point in market cycle, with a large portion of the return paid out as income each year. However, we would expect 10-12% return with a portfolio comprising mostly sector specialists and other niche strategies. The structure of investments would be similar to private equity, where the manager calls capital as lending opportunities are found. Typical fee structures are similar to private equity, involving a management fee between 1-2% on committed or invested capital, and a performance fee of 15-20% applied to gains, usually over a preferred return of 5-8% annually. The duration of private debt strategies tends to be less than that of private equity strategies. This is because contractual loans will have a finite maturity (5-7 years), while private equity rely on an exit event such as a sale of a business to generate funds; so private equity is more open ended in nature. We expect most private debt strategies to pay investors back their original investment amount within 5 years.
The key risks in private debt strategies are similar to those in public credit strategies. The principal risk is creditor default, where the company suffers from a material deterioration in operating performance that impairs their ability to meet contractual interest payments on their debt. A skilled lender will excel in their ability to assess whether a company can meet their contractual payments even in the event of adverse economic conditions (for example by avoiding highly cyclical businesses). The amount of debt in a company’s capital structure is a key risk metric for an investor to understand. The ratio of all loans to the value of the company is normally limited to between 50 and 70%, depending on the variability of operating earnings. This implies that there is a cushion of between 30 and 50% of the company’s value that could disappear before the loan value is threatened. Private loans are often tied to specific company assets as collateral and can vary in terms of seniority, defining who is first to be paid in a bankruptcy or other restructuring. Lenders typically use loan covenants to protect the value of their debt. Examples of covenants include interest coverage ratios that act as triggers for early repayment. All lenders rely on diversification to limit their risk of an individual company default affecting returns. The net return to investors always reflects the interest income plus loan fees, less the total losses (default rate multiplied by the portion of the loan not recovered). The normal loan loss recovery rate varies between 40-60%. So, a 6% overall portfolio default rate would translate into a 3% loan loss assuming a 50% recovery rate. Obviously, higher risk loan portfolios pay higher interest and fee income but have higher expected loan loss ratios. Senior secured lending to middle market companies can earn a return of 7-10% per annum net of default related losses. For comparison, US unsecured consumer debt, which is considered much riskier, can generate an 11-12% yield net of default related losses.
What we learned from the global financial crisis is that private debt can experience very high ‘mark-to-market’ losses. We saw some portfolios decline over 50% in value through to the market nadir in March 2009. We subsequently saw lenders finding creative ways to avoid driving companies into bankruptcy and default rates peaked at c. 12% with loss ratios of around 50%, limiting peak annual losses to c. 6% p.a. This compares favorably against 30-40% peak to trough declines in public equity valuations in the center of the financial crisis. The result was that these credit portfolios experienced dramatic recoveries on a mark-to-market basis in late 2009 and 2010. Investors in private debt should expect similar volatility in mark-to-market valuations and avoid the temptation to sell, thereby turning temporary losses into permanent losses immediately after any credit crisis.
IV. Hedged Equity Funds
Hedge funds can be separated into those that have high exposure to public equity markets and those that actively seek to not be influenced by changes in public equity returns. The latter are termed ‘Absolute Return Hedge Funds’ and are described in the next section. The former are termed Hedged Equity Funds because they reduce or hedge the overall risk of their long book
of equities with their short holdings. Investing ‘long’ means the fund owns the security whereas investing ‘short’ means that the fund lends the security or is betting that the price will go down. When the price of the stock rises, those long the security profit whilst those short the security lose.
A simple example of a ‘hedged’ equity portfolio would be one with $100 million of investor capital, whereby $100 million is invested in a diversified portfolio of equities (held long) and $50 million of equities are sold short (or borrowed and sold). In this example, $50 million of the full $100 million amount invested is ‘hedged’ such that only a net of $50 million is exposed to the equity markets. In this example, the ‘gross exposure’ is equal to 150% of capital ($100 million long + $50 million short / $100 million of investor capital). The ‘net exposure’ is equal to 50% ($100 million long – $50 million short /$100 million of investor capital). The gross exposure defines the true amount of your capital ‘at risk’ as the $100 million of long exposure and the $50 million of short exposure can go down in value at the same time in a very extreme scenario. But the intention of the hedged equity fund manager is to realize gains on both the long and short book. This defines the ‘leverage effect’ of hedged equity funds. In this example, the leverage is 50% as this is the amount of money at work (gross exposure) over and above the equity capital invested (i.e., 150% gross exposure less 100% equity invested). Hedge fund investors are counting on the correlation that individual stocks have to the market moves overall, to avoid this worst-case scenario. Hedged equity funds are also often referred to as ‘equity long-short funds’.
The example above is not far from how many Hedged Equity funds typically operate with an effective equity exposure (or beta) of 40% to 50% to public equity markets. Think of beta as a percentage factor relative to overall public equity market moves. For example, a hedged equity fund with an average of 50% beta is expected to only go up 5% when the overall equity market is up 10%. Similarly, if equity markets are down 10%, a hedged equity fund with 50% beta is expected to only decline by 5%. Any performance deviation from this is related to the manager’s skill and represents under or over performance.
Shorting a stock is not just a means of ‘hedging’ the overall long book of the portfolio but is an additional set of investment opportunities where a manager should have insights about why a company’s value might decrease over time, rather than increase. One can argue that long-only equity investors are only able to take advantage of half of the investment opportunities, those that they think will go up. Hedged equity fund managers have twice the opportunity set as long-only equity managers. Additionally, almost half of the effort that goes into research is wasted if you can only invest long. In contrast, the manager of a Hedged Equity Fund can choose to go long in instances where their research suggests the security is under-valued and go short in instances where the research suggest a security is over-valued. Thus, the productivity of research can be doubled by the manager of a Hedged Equity Fund which in turn encourages deeper research.
How does the investor short a security? Essentially, the broker to the Hedged Equity Fund lends the security to the fund. The fund has borrowed the stock and has to pay it back in kind at a specified date. After receiving the borrowed stock, the fund immediately sells the borrowed security and receives cash proceeds available for investing long. The fund then has the obligation to ‘cover’ the short in the future by delivering the stock regardless of what the price is at the time the debt of the stock is repaid. If the market price of the security declines during the borrowing period, then repaying the debt costs less than the cash proceeds from the original sale. This is how a short sale generates a profit on price declines. The source of the borrowed securities is usually other clients of the intermediating broker (such as the Foundation who lend securities via JP Morgan). Those other clients choose to lend securities in return for a commission. This commission plus the expenses of the broker mean that shorting a stock for extended periods of time can be expensive (often 1% to 2% per annum).
The other consequence of shorting is to introduce leverage into the Hedged Equity Fund. The greater the short exposure, the more cash is received by the manager from short sales and this provides an opportunity to re-invest the proceeds into the long positions held by the fund. The example above showed 50% leverage (two-parts equity to one-part debt). But hedged equity fund leverage can vary significantly from say 300% gross exposure (e.g., 200% long + 100% short) to 90% gross exposure i.e. not using any leverage (e.g., 80% long + 10% short, leaving 30% in cash).
The most successful Hedged Equity managers focus on the ‘long-short spread’ which is the difference in performance between the long positions and the short positions. If a fund can consistently deliver a positive long-short spread, then it can make profits beyond the market return and those profits are magnified by leverage. If a fund makes a 10% return on the stocks they hold long, and the stocks they hold short decline by 2% in the same period then the manager has a long-short spread of 12%. Hence, they have made a 12% return on their gross exposure, before expenses.
Sometimes Hedged Equity Managers invest through pair trades where they remove broad market impact by being equally long and short a particular sector. Most commonly, however, a Hedged Equity Manager will have an unrelated portfolio of long and short positions, where the overall exposure nets out around the typical 50% exposure referred to above. In either case, the leveraged long-short spread determines the level of outperformance or alpha.
The final point to note about Hedged Equity Funds is that the offsetting nature of longs and shorts provides an opportunity for risk management that is not available to long-only funds. The manager can neutralize certain risks from their portfolio where they lack conviction. For example, a Hedged Equity Manager may uncover information about fraud at a company in a certain industrial sector but have no conviction about broad developments in the sector. Were they just to short the company, then the fund would be at risk of positive developments in the broad sector offsetting all the gains they would make from price declines at the company. In this case, the Hedged Equity Fund could take a long position in the sector (through a basket of representative securities) so as to isolate the impact of the stock price declines at the fraudulent company. This approach is at the heart of risk management within Hedged Equity Funds.
V. Absolute Return Hedge Funds
Absolute return strategies exploit market inefficiencies to generate returns that have little or no correlation to mainstream traditional asset classes such as stocks and bonds. The general goal of Absolute Return Hedge Funds is to earn a modest return typically between 4% to 6% (net of all fees) which brings significant diversification benefits to a traditional portfolio and improves portfolio risk-adjusted returns. The strategy more often than not involves buying one security with more attractive valuation characteristics and shorting a similar security with less attractive valuation characteristics.
There are many different strategies that could be described as absolute return, but all follow the broad premise of targeting returns that are not highly correlated with equity market returns or other non-equity market returns including bonds, commodities and property returns. Absolute Return Hedge Funds can be split into the following broad categories:
Relative Value: Relative value strategies aim to exploit mis-pricings between two closely economically linked securities. For example, a company may have two share listings in two different stock exchanges (e.g. Shell has share listings on the Amsterdam and London Stock Exchanges). The behavior of local investors may result in different valuations implied by the two listings, and arbitrageurs would look for this valuation gap to close by owning the shares with the cheaper valuation and shorting the shares with the more expensive valuation. Another example is owning a 2-year Treasury bond long and shorting the 10-year Treasury when they are yielding the same yield (the yield curve is flat) and the investor has strong reason to believe the yield curve with steepen with the relative interest rate rising. This trade is hedged against overall interest rates rising or falling and is only exposed to movement in the relative yield of each bond.
Event Driven: Event driven situations are those that are expected to behave independently of broader market movements and are tied to the completion of a specific corporate event, for example the consummation of a merger, or the emergence of a company from restructuring or bankruptcy. The event has the potential to drown out the impact from general stock market due to the extreme significance of the event on the company. The reason an opportunity exists is because of the inherent complexity in business combinations or re-organizations which creates uncertainty in the minds of investors as to whether the event will occur or how markets will react if it does. The opportunity set in event driven strategies is created when securities are sold by investors who do not have the specialist knowledge or resources to understand the implications surrounding a complex corporate transaction. Merger arbitrage is a typical event driven absolute return strategy. The returns from this strategy are related to the manager’s ability to predict the probability that an acquisition will go through as well as the likely timing and the final consideration. Upon announcement of a takeover of a listed company, the acquiree company’s share price will rise close to, but below, the takeover price. The difference between where the share price migrates to and the announced takeover price reflects the market perception of the likelihood of the deal closing. The bigger the gap the more risk is associated with the deal not closing (this gap is referred to as the ‘merger spread’). Having identified whether the transaction will close or not, the merger arbitrage investor will buy the shares of the takeover candidate and short the shares of the acquiring company and will profit from the elimination of the spread between the two shares when the deal closes. Because the arbitrageur holds a long equity position and a corresponding short position, the exposure to the market is hedged out, so the direction of the equity market plays a small role in the position’s returns.
The key risk in a merger arbitrage strategy is mainly focused on deal break risk and the risk that a manager fails to analyze the merger prospects correctly. However, given most announced deals close, the return available to investors is usually less than the expected returns from a risky asset class such as long-only equities. In order to generate a higher return, many merger arbitrage managers use leverage to increase returns. Given the high level of active management, fees are typically higher than most long-only mutual fund strategies with fees ranging between 1% to 2% of assets charged as a management fee and a 20% performance fee charged on profits.
It should be noted that during times of financial crisis the correlations increase between merger arbitrage returns and traditional stock market returns. Large and swift declines in overall equity markets lead to event driven investors selling assets as mergers tend to collapse in market sell-offs. The strategy offers little protection in times of deep market stress. However, over time investors realize that the most companies fulfil contractual commitments and complete previously announced merger transactions.
Global Macro: Global macro strategies seek to benefit from a manager’s insights into how major macro-economic events will affect relative asset class valuations including currencies, interest rates, equities, commodities and credit. The low correlation of the overall macro fund’s exposure to traditional asset classes is due to the active manager being free to take positions both long and short in the above-mentioned asset classes. Managers can either make these decisions systematically (model driven) or on a discretionary basis (human driven) or some combination of the two.
Other: Other absolute return strategies include alternative return streams that do not seek to exploit inefficiency, but instead seek to be paid for taking an idiosyncratic risk that has nothing to do with risks experienced in traditional financial markets. One such strategy is catastrophe insurance which specializes in writing bespoke retro-reinsurance contracts for the traditional reinsurance industry. Retro reinsurers are reinsurers of the first level reinsurer. Investors are paid to insure the losses of reinsurers in the event of a catastrophic natural disaster. Examples include
Hurricane Sandy and the Tohoku Japanese Earthquake. In the event of one to two major disasters, highlighted losses can be substantial (in the order of -10% to -30%) but investors have historically been well compensated for taking this uncorrelated risk over the long run.
In Absolute Return hedge fund investing, it is critical to diversify across 8 to 12 managers to minimize the effects of any one strategy not working over a five-year period. The individual strategy risk is high, but they are typically uncorrelated to each other. With ample diversification, we typically see 5% average annual returns with a similar annual volatility of returns of 5% which is an excellent risk-return ratio when comparing it to traditional asset classes (e.g., public equities 5.5% expected future return with an average annual volatility of 14%.
Concluding thoughts on Alternative Asset Class Investing
The purpose of this note is not to convince the reader that alternative asset classes are better or worse than more traditional asset classes. The goal is rather to enable the investor to engage in productive discussion and debate about whether and when specific alternative investments may be suitable and appropriate additions to an otherwise well-diversified traditional investment portfolio.
1 This estimate of performance returns is based upon certain assumptions which should not be construed to be indicative of actual events that will occur. There is no assurance that the performance presented will be achieved.