Article
Five Steps to Optimizing After Tax Investment Returns for New York City Tax Payers
26 September 2019
When investing, taxes matter more than you think and more than you would like. For wealthy New Yorkers, it just got worse as the state and local tax burden, one of the highest in the country at 12.7%, lost the bulk of its deductibility against federal taxes. Adding together federal, state, and Obamacare (Net Investment Income; “NII”) tax, translates into a maximum rate for ordinary income of 54% and a maximum rate for long-term capital gains of 37%. At the same time, projected asset class returns are declining. Accordingly, we believe optimization of after-tax investment returns has become an even more critical element of portfolio management for taxable investors.
This white paper summarizes our learning from many years of research and experience in optimizing after-tax return for US taxpaying clients. We start with an explanation of how taxes impact typical portfolios and then we lay out our five-step process for optimizing after-tax investment returns.
Partners Capital was founded 18 years ago to bring what we believe to be the most advanced institutional investment approach to our clients. The foundation of this approach (often referred to as “the endowment model”) is multi-asset class diversification. Many “alternative” asset classes are relatively tax inefficient. “Alternatives” are often riddled with tax complexities that must be carefully understood.
While many US investors have embraced the endowment model, we find they have not always properly accounted for these tax inefficiencies. Many clients we encounter in New York City have taken the attitude that after-tax returns will “all come out in the wash” by targeting the highest pre-tax returns, which is simply untrue. For example, at the extreme you could find yourself paying over 70% taxes on certain hedge funds classified as “investor status” as you pay taxes on returns gross of management fees (i.e. management fees are not deductible).
Careful optimization of after-tax performance in an endowment-style portfolio increases annual post-tax returns nearly 30% (+1.2% annual incremental post-tax returns) compared with what could be achieved by ignoring taxes and optimizing pre-tax performance. Specifically, we project a 7.5% endowment-style return, typical for today’s sophisticated investors focused on pre-tax results, will be taxed at 43%, delivering an after-tax return of 4.3%. When we set out to maximize post-tax returns, we believe private clients can achieve a 5.5% after-tax result (1).
This incremental return approaches the significance of the full +1.8% of total annual outperformance (alpha) generated by leading institutional investors such as the Yale endowment. Without a clear tax optimization plan, all the effort that goes into generating pre-tax outperformance through sophisticated investing can be erased by ignoring taxes.
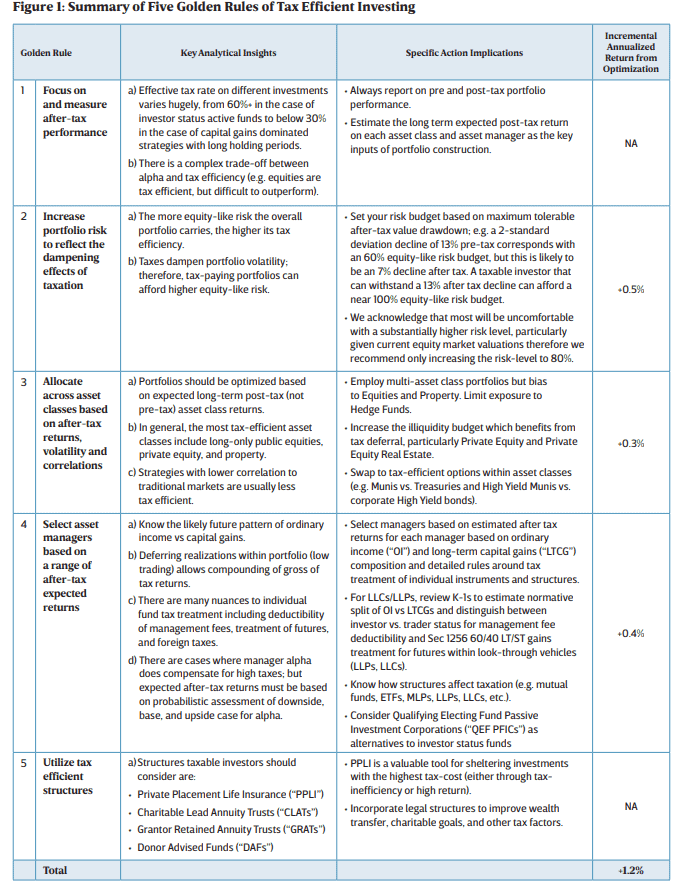
Our goal is to maximize expected after-tax results from a multi-asset class portfolio with a relatively high level of certainty. To do this, we have developed the following five Golden Rules of Tax Efficient Investing:
1. Focus on and measure after-tax performance
2. Increase portfolio risk to reflect the dampening effects of taxation
3. Allocate across asset classes based on after-tax returns, volatility and correlations
4. Select asset managers based on a range of after-tax expected returns
5. Utilize tax efficient structures
In Figure 1, we more fully define the five Golden Rules and their contribution to the potential improvement in post-tax returns.
How Taxes Presently Impact New York City Tax Payer Portfolios
Over the past ten years tax rates have climbed and are taking an increasingly large share of investment portfolio gains. At the same time, slow economic growth, quantitative easing and low interest rates worldwide have decreased forward looking returns across asset classes. The result is an environment where post-tax take-home investment gains have eroded. When considering inflation, the impact on real after-tax returns is even more dramatic.
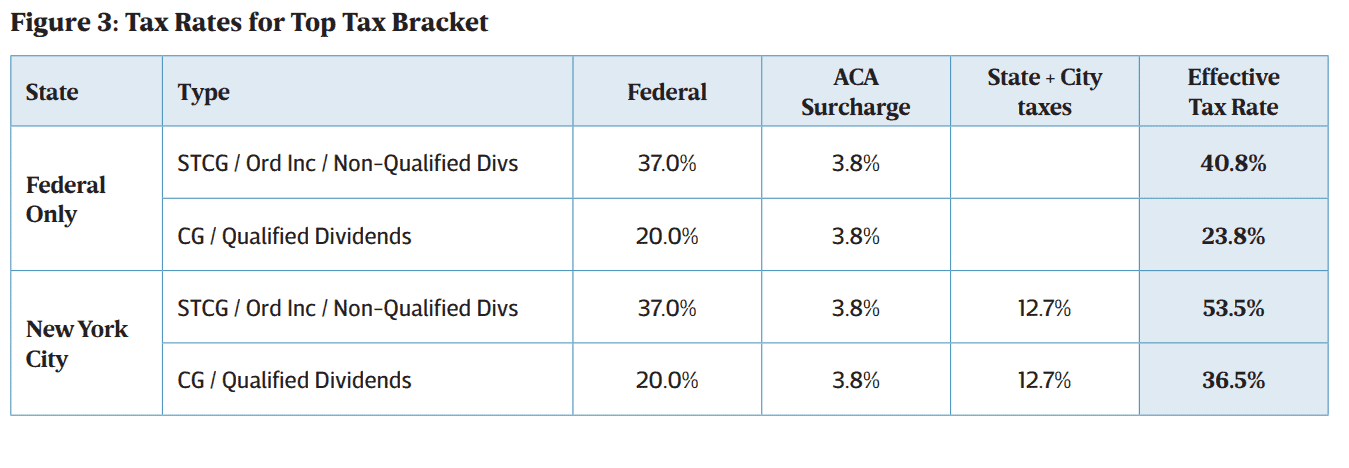
At the federal level, tax rates for short-term capital gains are up from 35% to 40.8% and long-term gain rates have risen from 15% to 23.8%, including the 3.8% Net Investment Income (NII) “Obamacare” Tax. While the 2017 Tax Cuts and Jobs Act decreased the top federal tax rate from 39.6% to 37%, we expect most wealthy New York City income earners will see minimal benefit or even an increase in their effective rate due to reductions in allowable deductions and the $10,000 cap on state and local tax (SALT) deductions(2). This is particularly hard-hitting as New York City residents face one of the highest state and city tax rates in the country at 12.7%. For example, for New York City tax payers in the top state and federal brackets for annual income saw their tax rate on income increase by 12.0% from 2008 to 2018 given the increase in state and city taxes from 2009-2012 and the cap on SALT deductions from federal taxes in 2017.
When you put all these taxes together for New York City residents, as seen in Figure 3, short-term capital gains, ordinary income, and non-qualified dividends are taxed at a maximum rate of 53.5%. Long-term capital gains and qualified dividends are taxed at 36.5%; hence a 17% spread between short-term and long-term capital gains treatment. This means a portfolio implementing the asset allocation of a typical endowment-style portfolio will give away almost 44% of gains in taxes, inclusive of the state and city levy, up from 31% taxes 10 years ago, as seen in Figure 4. The tax increase has occurred coincident with an environment where expected returns have fallen across asset classes, exacerbating the impact.
We estimate that today’s typical endowment-style multi-asset class portfolio has an expected pre-tax return of 7.5%(3). This is down from 9.5% annualized pre-tax return ten years ago, as shown in Figure 4. The decrease in returns, in conjunction with higher tax rates means that after-tax annualized results have declined over 35%, from 6.6% in 2008 to 4.3% today, as shown in Figure 3. Subtracting inflation of 2%, real after-tax results have been cut in half, from 4.6% to 2.3%.