Article
Inflections: Bond Yields Rising “like it’s 1999”
30 September 2026
“I used to think that if there was reincarnation, I wanted to come back as the president or the pope or as a .400 baseball hitter. But now I would like to come back as the bond market. You can intimidate everybody.”
– James Carville, chief political advisor to U.S. President Bill Clinton.
As yields on government bonds soar past one high after the next, a realization is dawning on investors and policymakers: More than merely a bond-market slump, this appears to be a fundamental shift. US 10-year yields are now at c. 5.2%, over 1% higher than in late February and at the highest level since 2006. Yields in the UK, Eurozone and Japan have also experienced similar moves.
There are two distinct characteristics of this recent shift: a) it is global, with bonds across many major developed economies moving up in concert; and b) it is driven primarily by faster economic growth and less so by rising inflation expectations and/or fiscal sustainability fears.
Economic growth is running above potential
Despite elevated energy prices from ongoing geopolitical upheaval in Ukraine and the Middle East, as well as trade policy uncertainty, the global economic expansion is entering the fourth quarter with building growth momentum and persistently elevated inflation, raising the prospect of further monetary policy tightening. The US Federal Reserve recently upgraded its 2026 real growth forecast to 2.3%, and 2027 to 2.4%, both well above estimates of potential at 1.8% -2.1%. Wall Street estimates for the Q3 run rate are coming in at a whopping 3.5%.1
The long-term relationship between bond yields and nominal growth remains broadly intact – suggesting scope for further upside for yields
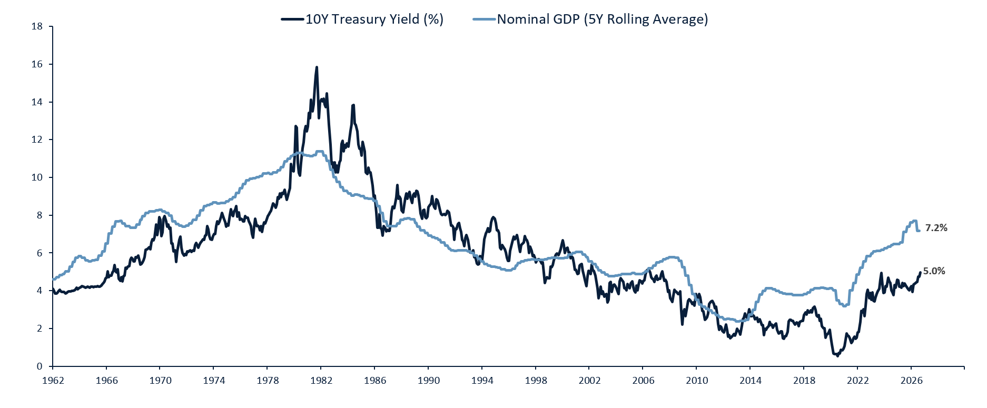
Source: Bloomberg, Partners Capital Analysis
Longer-term inflation expectations remain well-anchored, despite firm inflation
Following the Iran war, headline inflation has risen due to energy shortages, but core (ex-food, ex-energy) inflation is also elevated. US core PCE inflation at c. 3% has remained well above the Fed’s 2% target for over five years. Nevertheless, market measures of the average US inflation rate over the next 10 years continue to be rangebound around the 2.3% level. Some experts believe the spike in diesel prices to a record $6.50/gallon has the potential to further boost core inflation given its pass-through into physical goods transport, agriculture, construction, etc.2
Limited fiscal premium
Moreover, the US fiscal deficit at c. $2T p.a. remains elevated at c. 6% of GDP and is biased further upwards due to rising defense spending and debt servicing costs. However, so far the added risk premia on longer-maturity bonds remain limited. The N.Y. Fed’s measure of the 10-year term premium (the extra return a fixed-maturity bond offers above the expected return of a series of rolling short-term T-bills over the same period) remains roughly unchanged year-to-date, at c. 0.8%. This is well below its long-term average of c. 1.5%, though higher than during the post-GFC decade.
The Fed is rarely ‘one and done’
On 16 September 2026, the Federal Reserve raised interest rates by 0.25%, its first hike since July 2023. Looking back at the last 35 years, it becomes evident that after the initial rate increase, the Fed often keeps going.
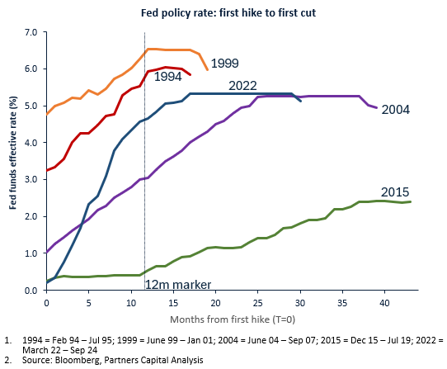
In addition, although an active Fed should calm inflation fears, the 10-year yield often continues rising for months after the first hike. This happened in the 1994, 1999 and 2022 cycles.
How high could bond yields go? The late 1990s may provide a better roadmap than the 1970s
Clearly, any easing of tensions in the Middle East would provide some downside relief to yields. However, a scenario of lower energy costs would also likely boost real growth. As long as growth rates remain elevated, the scope for yield declines is limited. With the unemployment rate already low at 4.1%, even tighter labor markets would further bias the Fed towards tight monetary policy. Moreover, any increase in inflation breakevens and/or term premia would likely add further upside.
Many investors look at today’s energy price shock and draw parallels with the high inflation period of the 1970s. That period culminated in a peak 10-year yield of c. 16% in 1981. A key difference today is that we do not see evidence of 1970s-style stagflation, given the robust levels of real growth. We believe a better comparator to the current context is the late 1990s period when the US economy was benefiting from another tech-led boom. The 10-year yield in early 1999 was c. 4.7%, not too far from this year’s average levels. After the Fed began raising policy rates in mid-1999, the 10-year yield jumped to 6.7% by January 2000, peaking just before the bursting of the dot-com bubble in March 2000. The ensuing recession eventually led to yields declining again.
Equities have remained resilient along with economic growth
Since the start of the year, rising rates have contributed to a moderate derating of Global Equities3 (valued at 17x next 12-month earnings vs 21x in January). However, this effect has been more than offset by strong earnings growth estimates for the next 12 months (c. +23%), resulting in a c. +14% year-to-date return.
Looking ahead, if interest rates continue rising to the extent that corporate earnings are negatively impacted, any further equities upside will be constrained. If economic growth were to slow sharply as a result of higher rates, equities would suffer a more meaningful downward impact.
Multi-Asset Portfolios are better placed, but not immune
For multi-asset investors, a higher correlation between bonds and equities is a key concern. The correlation, which had been negative for most of the past two decades, has generally been positive since 2022 – similar to the 1980s and 1990s.
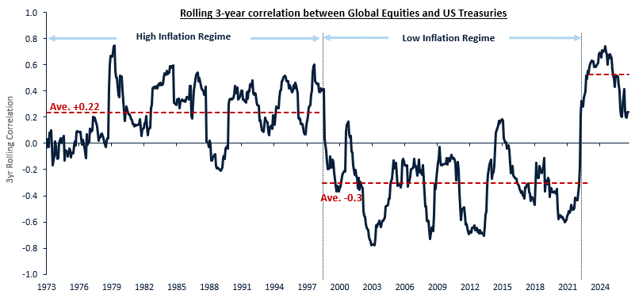
Notes:
- Chart shows the 3-year rolling correlation of the MSCI World TR Index and the Bloomberg 5-10 year Treasury Index
- Source: Bloomberg
Simple 60/40 equity/bond portfolios suffered sharp declines in 2022, a year in which central banks belatedly raised interest rates sharply to combat a post-pandemic inflation surge that turned out to be less transitory than expected.
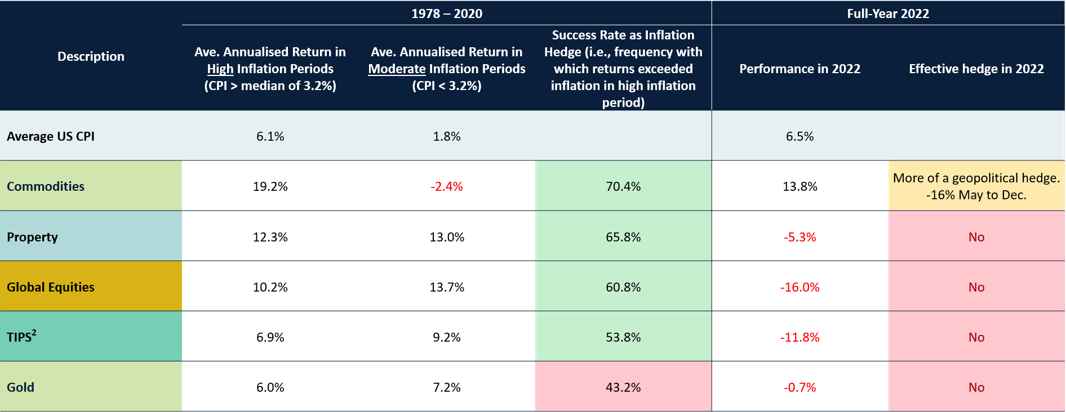
Focusing on that year as a poster child for extreme correlation, multi-asset portfolios fared somewhat better, particularly those holding less-correlated assets (e.g., shorter duration bonds and Absolute Return) and more floating-rate exposure (e.g., via Private Debt). However, classic inflation hedges (inflation-protected bonds, real estate and gold) suffered. Broad commodities (driven by energy) initially rose just after the Russia/Ukraine conflict broke out, but subsequently gave back much of their early gains.
Although inflation was elevated in 2022 (US CPI peaking at 9.1%), many assets often considered to be ‘inflation hedges’ performed poorly due to the impact of rising interest rates, with US 10-year yield rising from c. 1.5% to c. 3.9%.
Classic ‘inflation hedges’ underperformed in 2022
Notes:
- “Success rate” is defined as the relative frequency with which returns equaled or exceeded inflation during episodes of high inflation in our sample, thereby accomplishing the usual goal of protecting purchasing power.
- US TIPS have been available only since January 1997, so the performance of TIPS in providing inflation protection cannot be evaluated using actual returns during the inflationary periods of the 1970s and early 1980s. The analysis shown above used the synthetic TIPS return series estimated by Ibbotson Associates.
- Indices used to represent asset class returns are: Commodities – Bloomberg Commodity Index; Property – UK IPD All Property TR; Global Equities – MSCI All Country World Index NR LC; TIPS – Barclays U.S. TIPS TR; Gold – S&P GSCI Gold Official Close Index TR.
- Source: Bloomberg, Partners Capital Analysis
The bull case for bonds – an ‘AI wobble’ scenario
Broadening our scope to include recent AI developments, there is at least one plausible scenario where bonds outperform significantly. As safety concerns related to AI agents increase, any incident that leads to a broad-based pullback in AI capital expenditure would likely support bonds through two main channels. First, economic growth and inflation would likely slow, removing a key supporting plank for yields. Second, the issuance of debt to fund the AI buildout would also decrease. Estimates of total AI-related debt issuance so far this year are currently at a massive c. $0.5T.4
While we do not ascribe a specific probability to the above scenario, we know from past episodes of rapid technological development that the context can change rapidly. Beyond rising interest rates, another catalyst that led to the dot-com bust in March 2000 was the oversupply of so-called ‘dark fiber’ or excessive and unused infrastructure buildout. Although order books by data center suppliers such as semiconductor companies currently appear full for the next couple of years, this demand is already priced in so the risks could be skewed downwards.
In summary, we believe a diversified multi-asset approach continues to provide superior resilience across a wide range of possible scenarios. For bonds specifically, we see near-term risks of further yield increases but hold an overweight to shorter duration instruments given the attractive yield, and a modest underweight to longer duration bonds which can be extended if the AI downside scenario gains traction.
Sources
- J.P. Morgan Economics 25 September 2026
- Apollo Global Management 23 September 2026
- MSCI AC World – all data sourced from Bloomberg
- Financial Times